What denials cost you, in dollars.
An Excel calculator that turns claim volume, reimbursement, and denial rate into dollars denied, dollars recovered, rework cost, and the net annual loss, plus what a lower denial rate would be worth.
A denial rate is easy to report and hard to act on until it is expressed in dollars. Twelve percent of claims sounds manageable; the same twelve percent as a seven-figure annual loss gets a different response in a budget meeting.
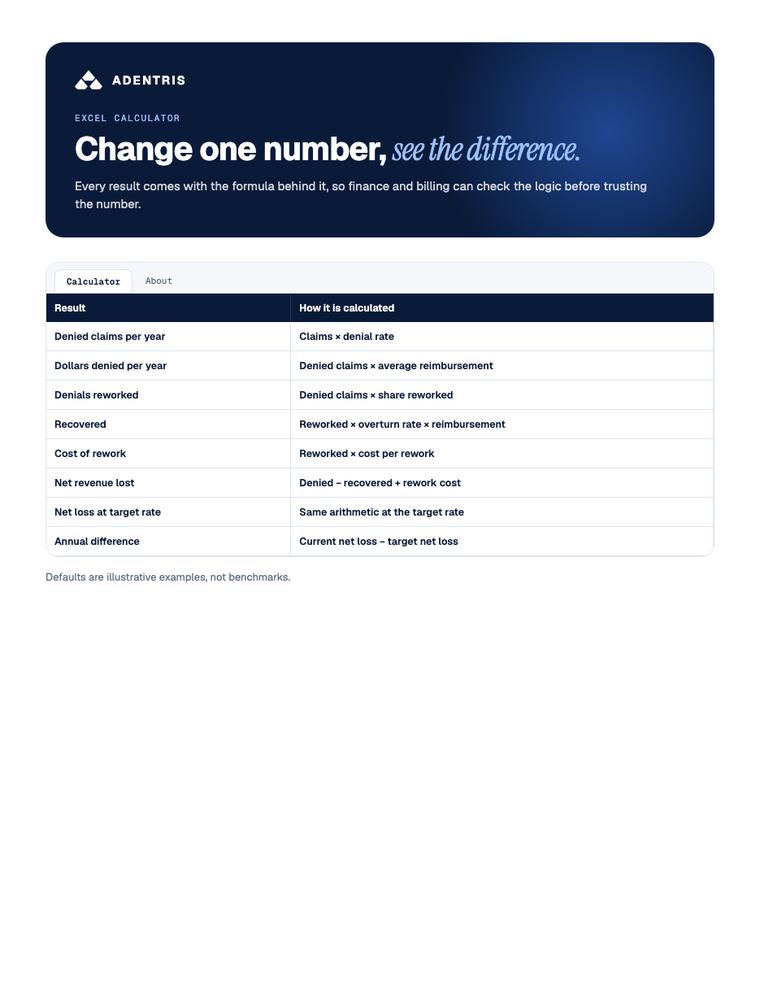
This calculator does that translation in the open. Enter your claim volume, average reimbursement, denial rate, how many denials your team never reworks, and how often reworked denials are paid. Every result is a visible formula, so finance and billing can check the arithmetic before trusting the number.
What is inside
- Seven inputs, each with a note on where to find the number
- Dollars denied, recovered, rework cost, and net loss per year and per month
- A target denial rate scenario and the annual difference it makes
- Every formula visible and editable
Seven inputs, nine answers.
You enter
- VolumeClaims submitted per year and average reimbursement
- DenialsFirst-pass denial rate and share never reworked
- RecoveryOverturn rate and cost to rework one denial
- TargetThe denial rate you want to reach
It calculates
- DeniedClaims and dollars denied per year
- RecoveredDollars recovered on appeal or correction
- Net lossPer year and per month, after rework cost
- DifferenceWhat the target denial rate is worth annually
Built for the people who work the denials.
- CFOs and revenue cycle leaders building the case for denial prevention
- Billing managers who report denial performance
- Practice administrators at multi-site groups
Related on this site: Denial Fightback, AR Audit and RCM Insights.
Download the Excel fileCatch these before the claim goes out.
Adentris reviews charts and claims against payer rules before submission, so missing documentation, modifiers, and authorizations surface while they can still be fixed.